TagoIO HTTP Post
Overview
This sample application implements an HTTP client that will do an HTTP post request to TagoIO [1] IoT Service Platform. The sample sends random temperature values to simulate a real device. This can be used to speed-up development and shows how to send simple JSON data to TagoIO [1] servers.
The source code for this sample application can be found at: samples/net/cloud/tagoio_http_post.
Requirements
A board with internet connectivity, see Networking
The example provides three ways to get internet:
Ethernet: Using default configuration
WiFi: Using default configuration plus wifi overlay
TagoIO Device Configuration
If you don’t have a TagoIO [1] account, simple create a free account at
TagoIO [1]. After that, add a device selecting Custom HTTP(S) protocol. That
is it! Now reveal your device token. The token will be used to identify your
device when sending data. You need fill CONFIG_TAGOIO_DEVICE_TOKEN at
samples/net/cloud/tagoio_http_post/prj.conf file with that
information.
Building and Running
Ethernet
You can use this application on a supported board with ethernet port. There are many like SAM4E Xplained Pro, SAM V71(B) Xplained Ultra, FRDM-K64F, Nucleo F767ZI etc. Pick one and just build tagoio-http-client sample application with minimal configuration:
west build -b [sam4e_xpro | sam_v71_xult/samv71q21 | frdm_k64f | nucleo_f767zi] samples/net/cloud/tagoio_http_post
west flash
WIFI
To enable WIFI support, you need a board with an embedded WIFI support like
Disco L475 IOT01 (B-L475E-IOT01A) or you can add a shield like
ESP-8266 Modules or Inventek es-WIFI Shield. Additionally you
need fill CONFIG_TAGOIO_HTTP_WIFI_SSID with your wifi network SSID and
CONFIG_TAGOIO_HTTP_WIFI_PSK with the correspondent password at
samples/net/cloud/tagoio_http_post/overlay-wifi.conf file.
west build -b disco_l475_iot1 samples/net/cloud/tagoio_http_post -- -DEXTRA_CONF_FILE=overlay-wifi.conf
west flash
west build -b [sam_v71_xult/samv71q21 | frdm_k64f | nucleo_f767zi] --shield [esp_8266_arduino | inventek_eswifi_arduino_uart] samples/net/cloud/tagoio_http_post -- -DEXTRA_CONF_FILE=overlay-wifi.conf
west flash
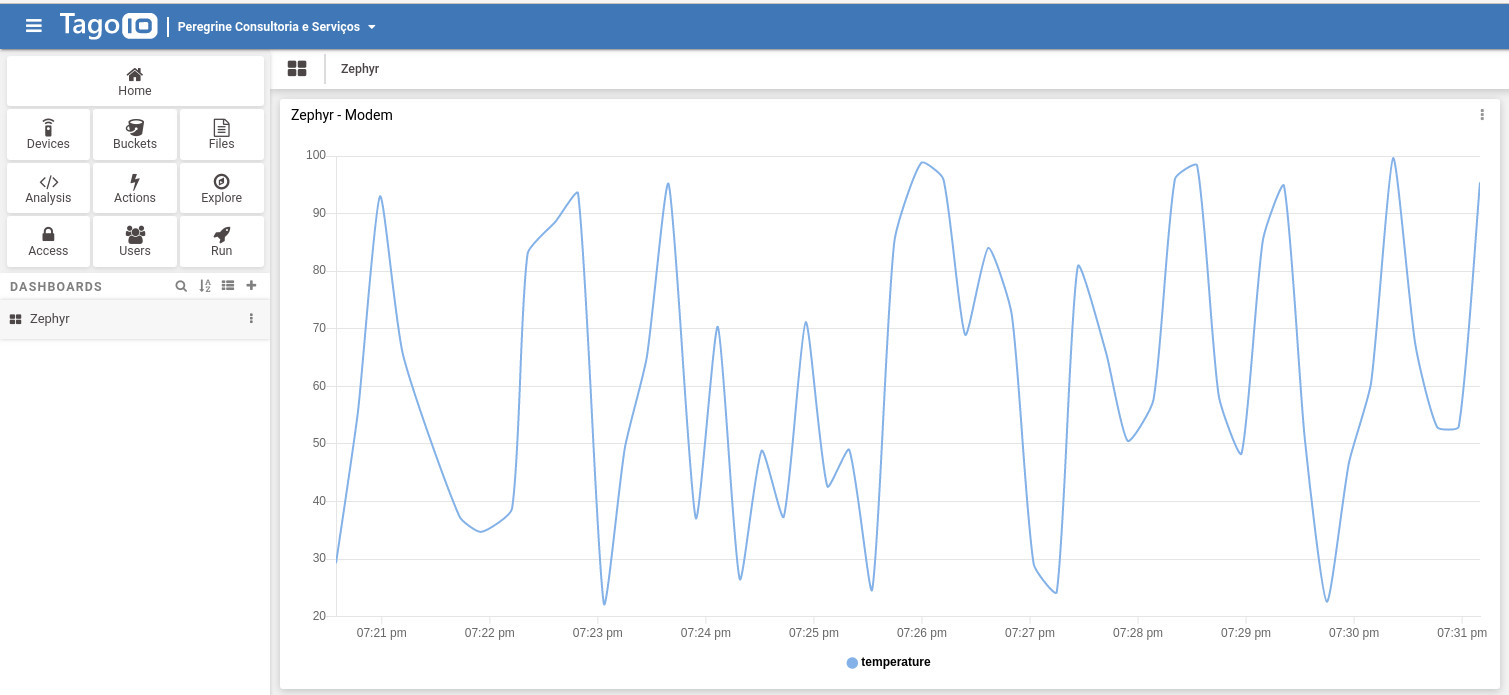
Visualizing TagoIO dashboard
After you got some logs on console it is time to create a dashboard on the TagoIO to visualize the data.
Go to the TagoIO web console
Create a dashboard as Normal, give it a denomination and move next
Add a line plot graph. You will see your device, temperature variable will be automatically selected for you.
Just Save and enjoy!
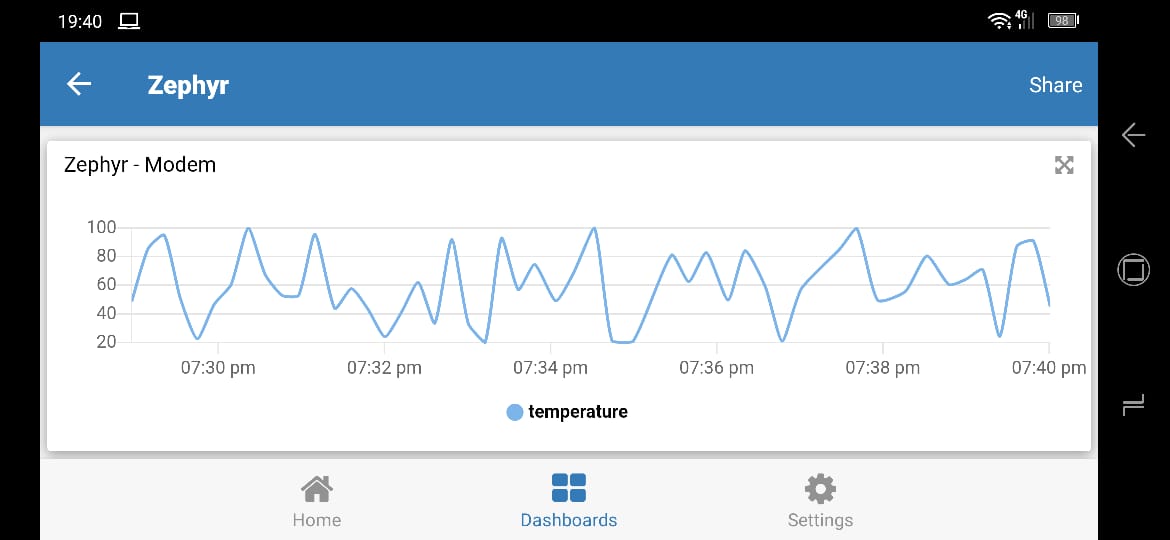
You can experiment the TagoIO mobile application on your cellphone or tablet. Simple go to your app store and search by TagoIO, install, sign in, enjoy!
More information at TagoIO [1] and TagoIO Documentation [2].